
Want to get more eyes on your tweets without paying for a third-party social media dashboard? You do not need to. Twitter gives you access to a full suite of analytics for free - if you know where to look.
Knowing which of your past posts generated the most activity helps you write better ones in the future. Twitter actually supplies all the data you need for free. You just have to know how to access it.
We will use the Twitter Ads platform. While it is built for running paid campaigns, the interface includes a free analytics dashboard that tracks how your organic posts are performing.
#1: Access the Dashboard
If you have a Twitter account, you already have access to Twitter Ads. Go to https://ads.twitter.com/ and sign in with your regular credentials. If this is your first time logging in, you will need to select your country and time zone. Double-check these settings before saving - you cannot change them later.
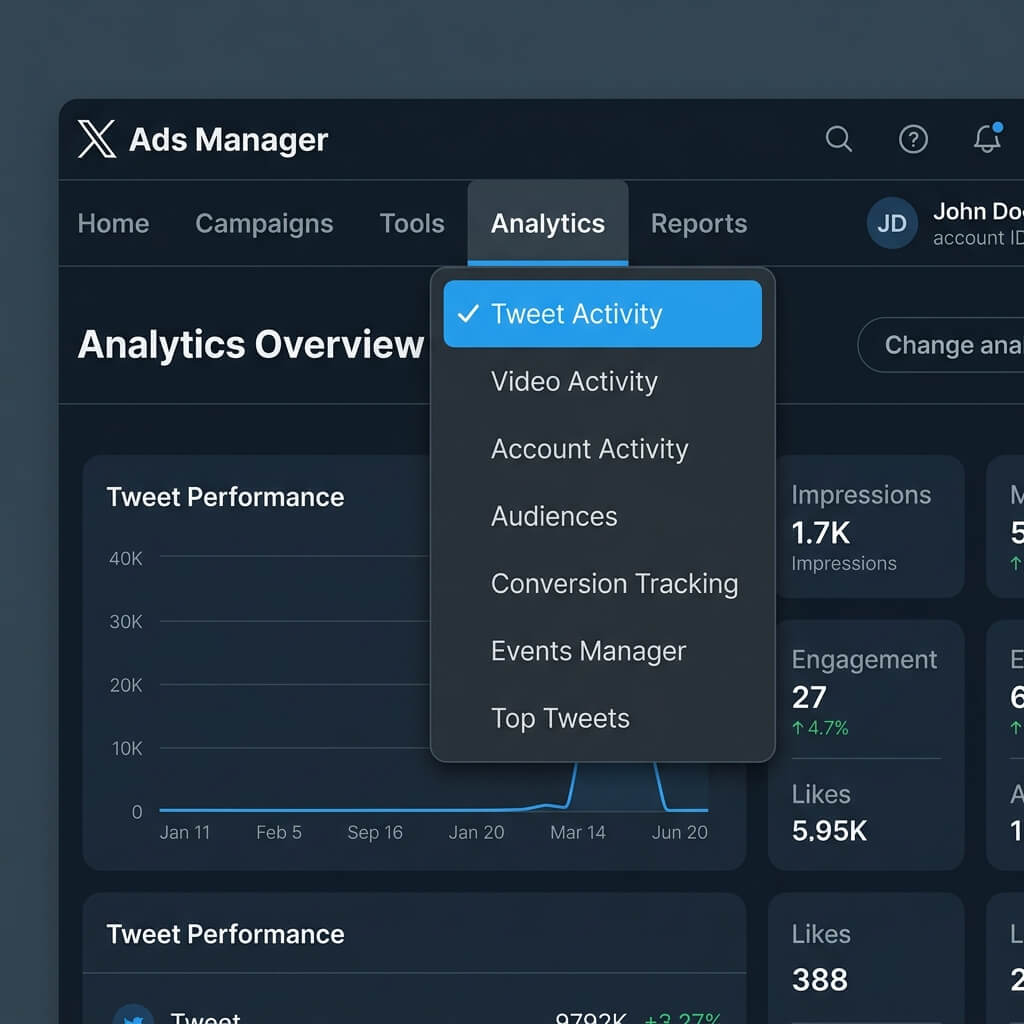
Once you are logged in, hover over the Analytics menu and click on Tweet Activity. If you have never accessed this dashboard before, it might show zero results. The data will start populating once you post new updates and generate views.
By default, the dashboard shows metrics from the last 28 days, including impressions, engagements, link clicks, retweets, favorites, and replies.
You can change the date range to view up to 92 days of data at a time. The only caveat is that Twitter only stores this history for 13 months, so you will want to export your reports regularly if you want to keep long-term records.
#2: Pull the Raw Data
Click the Export button in the top-right corner, just below your profile icon. Select the first 92-day window and export the data. This downloads an Excel file containing all metrics for that period. Shift the date range back by another 92 days and repeat the process. We want at least four months of continuous data to spot trends, but you can go back as far as 13 months.
Open each downloaded Excel file. Designate one as your master sheet. For the other files, delete the header row and copy the raw data directly into the master sheet.
Once you merge the files, you will have a single spreadsheet containing your entire posting history. To make the file easier to read, freeze the header row. Click the View tab in Excel, select Freeze Panes, and click Freeze Top Row. Now you can scroll through thousands of rows of data while keeping the column headers visible at the top.
#3: Find the Best Time to Post
An impression represents a single view of your post. To find when your audience is most active online, we need to locate the posts that earned the highest impressions.
Sort your master sheet by the impressions column in descending order.
To do this in Excel:
- Click any cell in the impressions column.
- Go to the Data tab on the ribbon.
- Click the descending sort command (Sort Z to A).
This reorganizes the sheet to show your most-viewed posts at the top. Look at the date and time columns for the top 50 entries. You will likely spot a few trends. For example, you might find that posts published at 9:00 AM on Tuesdays consistently perform better than posts sent out on Friday afternoons.
To make this analysis accurate, you need to have posted consistently at different times of day over several months. If you only ever post at noon, your data will only show how noon posts perform.
#4: See What Content Resonates
Knowing when to post is only half the battle. You also need to know what your audience wants to read. To analyze content performance, sort the spreadsheet by the engagements column in descending order.
Twitter counts any interaction - retweets, replies, likes, or link clicks - as an engagement. The more actions a reader takes, the higher the score.
Review the text of your top 50 posts. Look for common threads. Do your readers engage more with links to technical articles, short industry opinions, or casual photos? Focus your future writing on the formats and topics that already have a proven track record.
Conclusion
To recap: access your dashboard in Twitter Ads, download your raw CSV data, sort by impressions to find peak posting times, and sort by engagements to see what topics your audience actually likes.
Checking these reports every few months keeps your social media strategy aligned with your actual audience. The internet moves fast, and what worked last spring might not work this winter. If you are just starting out, space your posts throughout the day to build a clean baseline of data.
What do you think? Do you use Twitter analytics? Have you found other tools that help you track social media metrics? Let me know in the comments below.